This guide walks you through the Superads interface so you can confidently explore, edit, and share your reports.
Home Screen Overview
When you log in, you’ll land on the Home screen, which includes:
- Quick actions: Create a board, invite team members, or connect more ad accounts.
- Ad account status: See which accounts are synced and which date ranges are available.
- Widgets (coming soon)
- Sidebar: Access your workspace settings and your starter board with pre-built reports.
On the free plan, you can access up to three reports at once. If you reach that limit, either delete reports or upgrade to unlock more.
Report View Overview
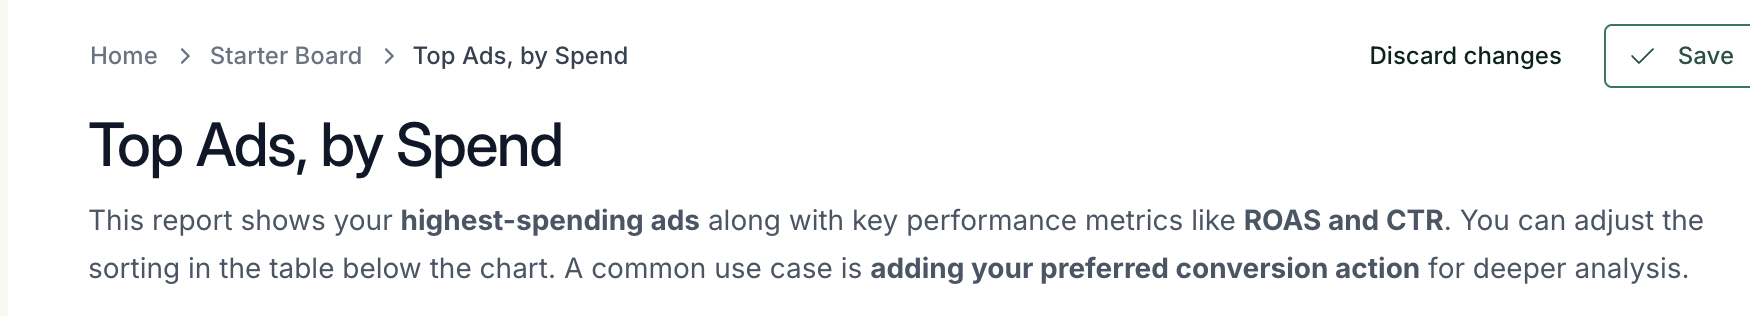
1. Title and description
- You define here the report title and description. Some may use the description section to provide an explanation of what the report is about or, in some cases, to provide a summary of any relevant changes.
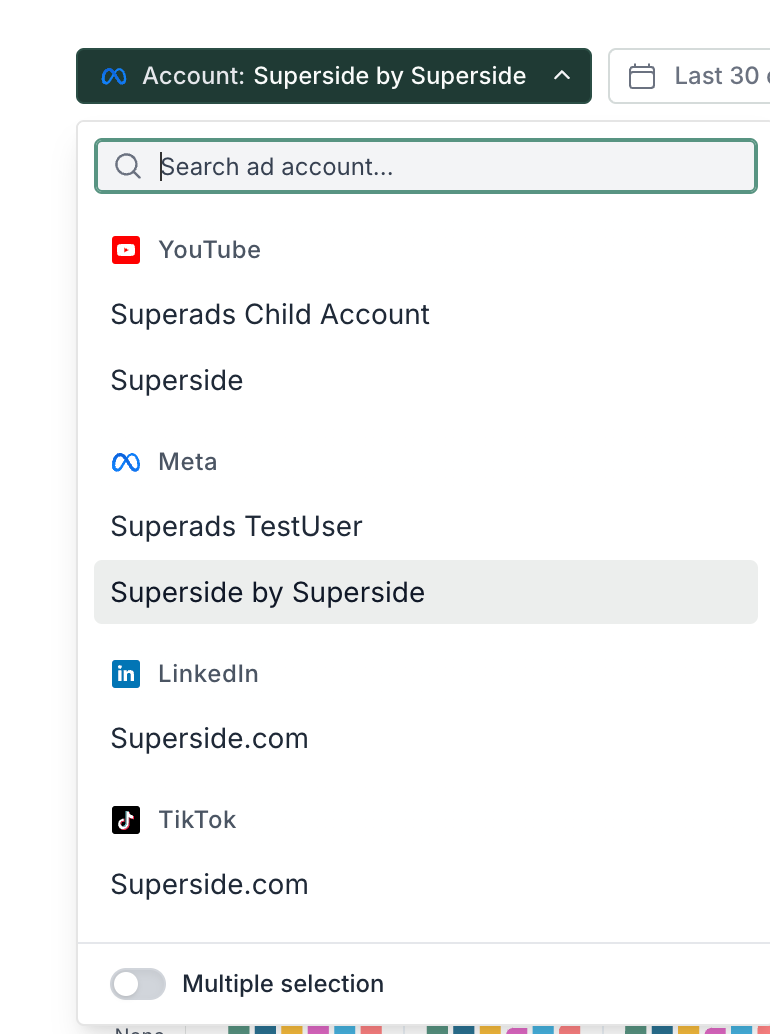
2. Data Controls and Filters
- Data Source Selector: Choose the ad account you want to analyze. We support Meta, TikTok, LinkedIn, or YouTube. Pro plans can select multiple accounts in one report.
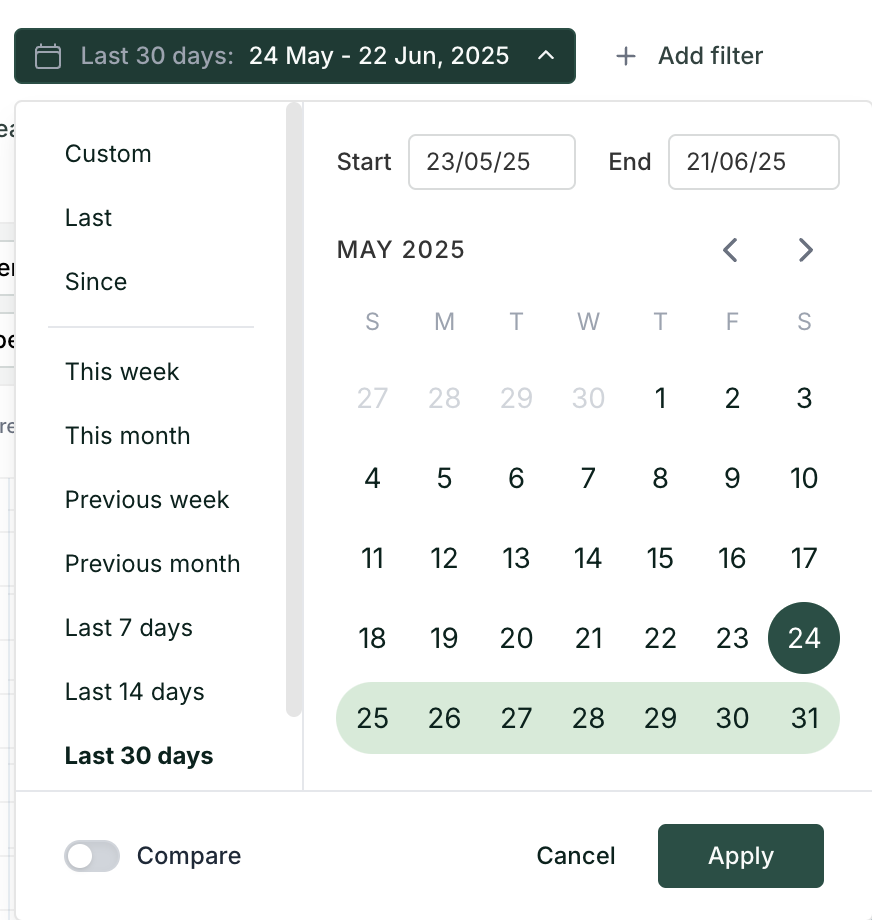
- Date Picker: Use custom, fixed date ranges or dynamic date ranges, like last N days/weeks/month, this week/month, etc.
- Free: up to 30 days
- Pro: up to 12 months
- Comparison Toggle: Easily compare performance across periods, matched by day of the week, so that you have the same number of weekdays and weekend days.
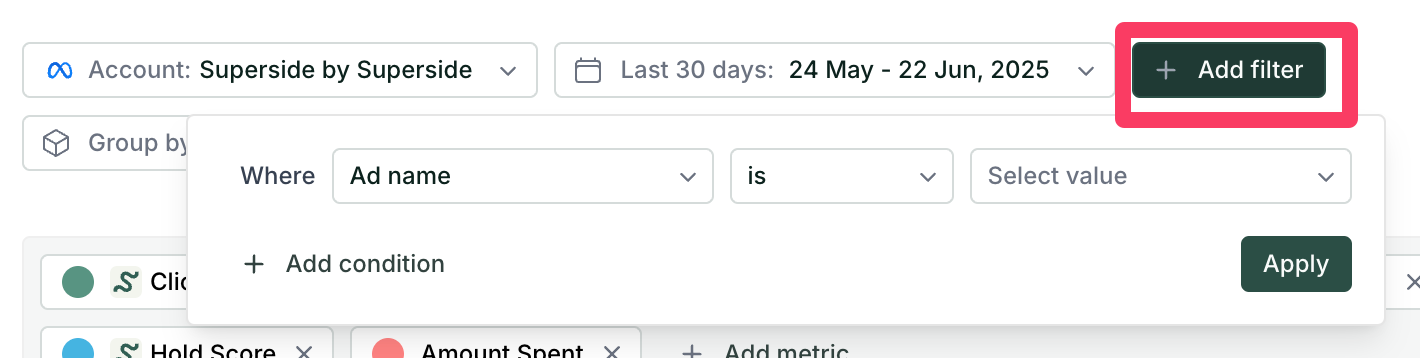
3. Filters
- Filter by any dimension or metric
- Supports AI-powered creative filters and custom filters (covered in next articles)
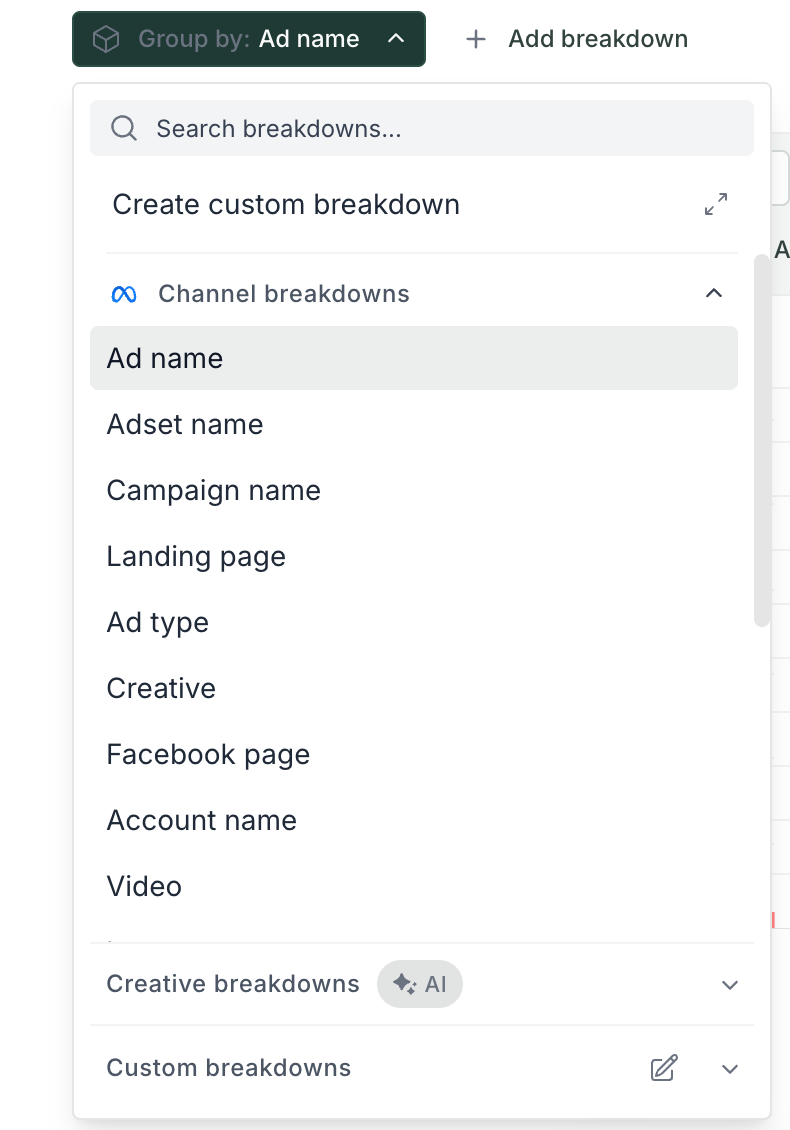
4. Groupings
- Group by platform-level dimensions: campaign, ad name, ad set, landing page, ad type, etc.
- Pro only: Group using AI-powered creative breakdowns like value prop or emotion
- Build custom groupings using your naming conventions, with optional AI assistance
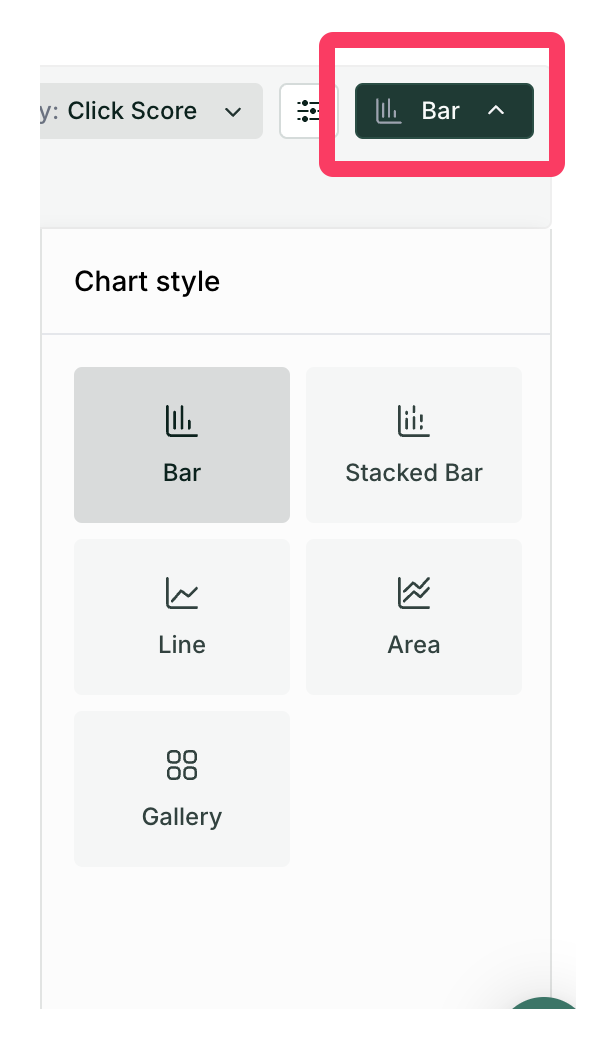
Data Visualization
- Choose chart types: bar, tag bar, line, area, gallery
- Select any metrics available in your ad accounts.
- Use Superads scores (Meta only) for quick benchmarks (explained in another article)
- Note: Meta custom metrics aren’t supported yet, but we support custom conversions.
- Toggle between chart only, table only, or both (default)
Deep-dive into any element
- Click on any element in a chart or table to deep dive into it:
- Drill into a specific ad, ad set, campaign, or creative
- Change the date range, add metrics, or modify breakdowns in the focused view
Ad preview
When using Gallery view and grouping by Creative or Ad Name, you can click an ad thumbnail to:
- Preview the actual ad (video or image)
- See performance metrics specific to that creative
Top Right Tools
- Publish button:
- Instantly publish your report and get a unique shareable URL
- Recipients see a live, fully interactive version
- Ask AI:
- Opens an assistant with full access to your ad account’s context
- Ask questions and get insights directly (covered in another video)
- Three-dot menu:
- Duplicate, rename, or export your report